// The Hodograph, Unfolded
Atmospheric Visualization · FullCourt Press LLC
HodoDecoder 3D restores the dimensions that standard atmospheric diagrams suppress — altitude becomes a spatial axis on the hodograph, and time becomes a spatial axis on the Skew-T. Fly through the wind profile that produced El Reno. Watch a sounding evolve hour by hour as a volume you can orbit.
Now Live// The Hodograph, Unfolded
// The Hodograph, In Motion
// The Skew-T, Through Time
// The Skew-T, In Motion
// Satellite + Lightning
// About the Project
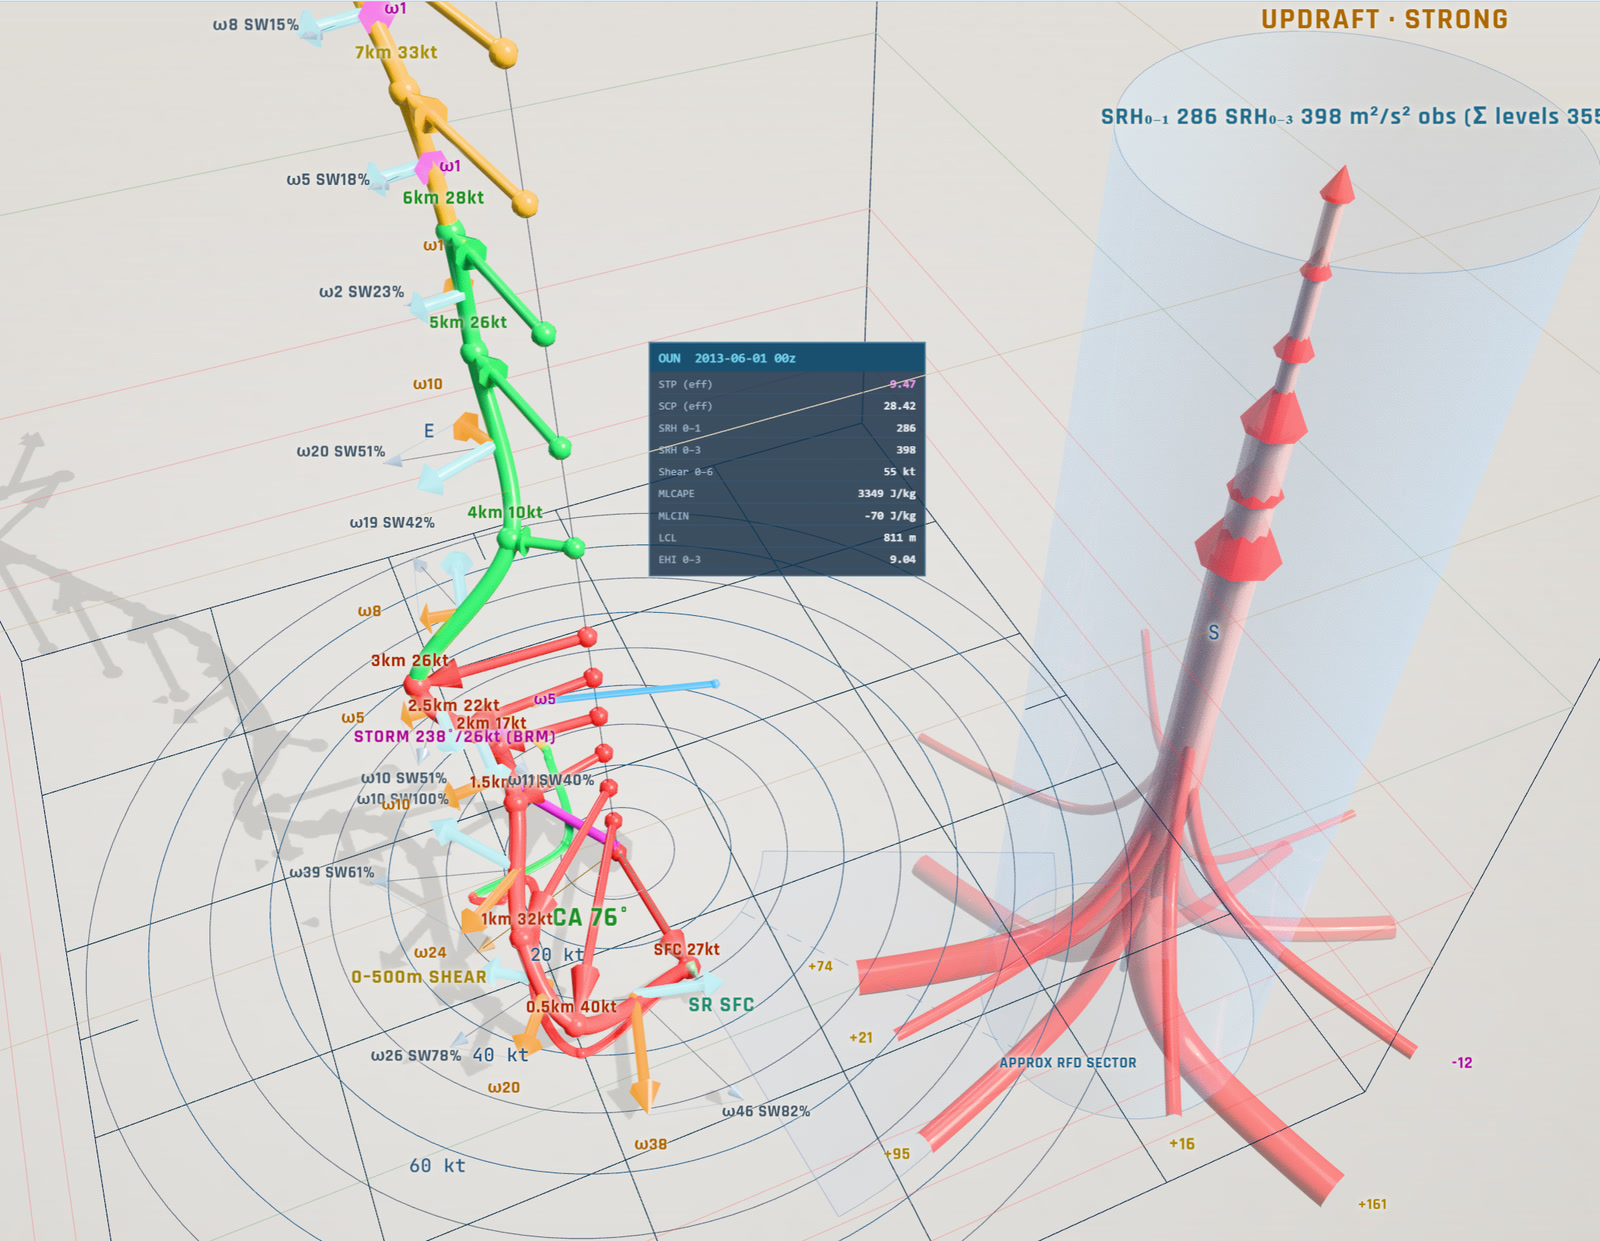
A hodograph plots the wind at each height of a sounding as a vector from a common origin, then connects the tips. The curve it traces shows how wind speed and direction change with height — the vertical wind shear and storm-relative helicity that decide whether a thunderstorm can rotate and produce tornadoes. On a flat hodograph, height survives only as tick labels; a 3D hodograph makes altitude a real axis, so the turning of the wind with height becomes a shape you can see directly.
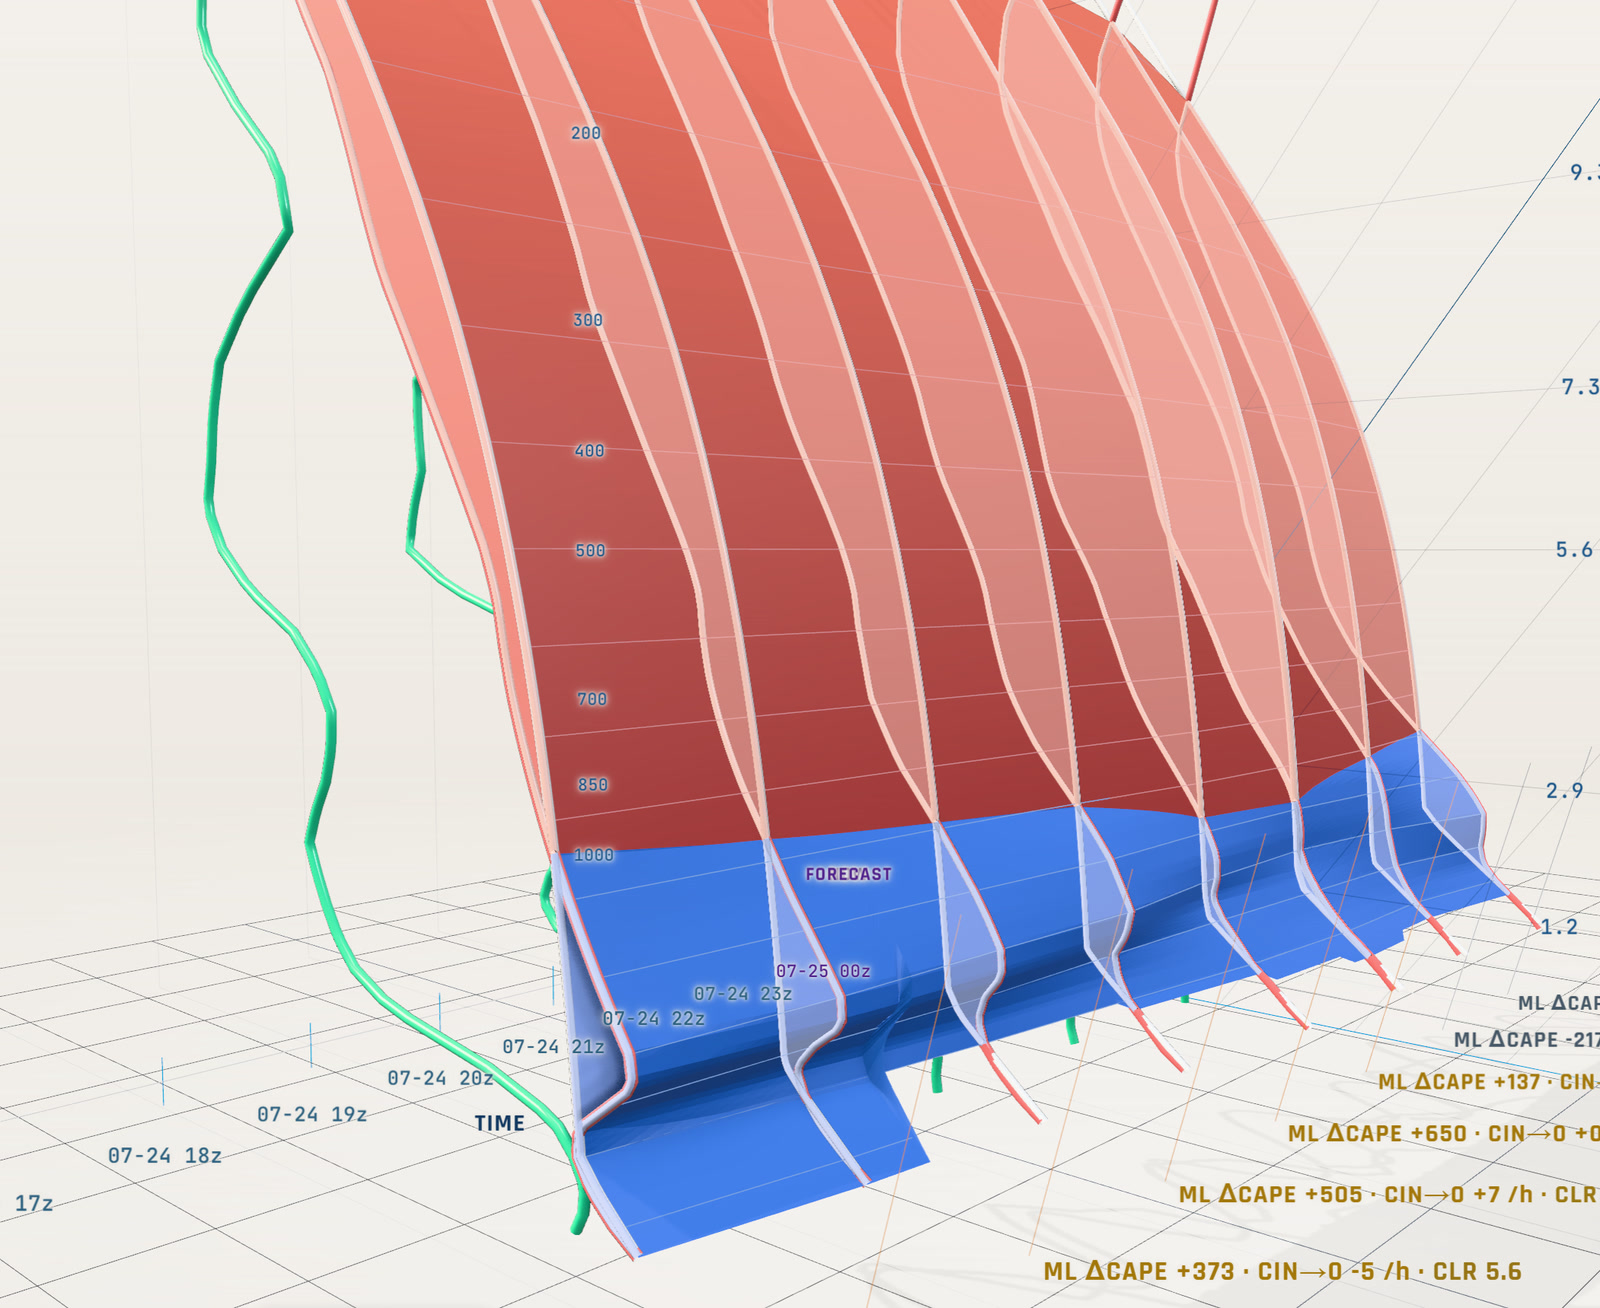
Every severe-weather forecaster reads hodographs and Skew-Ts. Both are brilliant compressions — and both pay for that compression by discarding a dimension. The hodograph flattens altitude into a line you must mentally re-inflate. The Skew-T freezes a single moment and hides how the atmosphere is trending.
HodoDecoder 3D puts those dimensions back. The wind profile becomes a structure you orbit, climb, and interrogate level by level. The sounding becomes a volume that carries its own history, so destabilization is something you can see rather than infer.
Validated against the storms that matter — the El Reno 2013 EF5 profile ships as the built-in 3D reference case — and engineered around one uncompromising rule: the display never claims more than the data supports.
// The Suite
The wind profile as a true spatial object — altitude on its own axis, with rotational character encoded directly into the trace. Orbit the structure, inspect any level, and read storm-relative geometry the way the storm experiences it.
Core · WebGLA time-evolving sounding volume. Successive profiles stack into a solid you can fly along, making destabilization, moistening, and capping trends visible at a glance — with observed cross-sections visually distinguished from interpolated ones, always.
Time EvolutionA full classical hodograph workbench with severe-weather parameters, storm-motion vectors, and a research-derived tornado-probability nomogram — plus one-click handoff of any profile into the 3D suite.
Analysis + HandoffPull observed radiosonde launches from the global archive or generate model pseudo-soundings from HRRR and RAP for any point and hour — server-side thermodynamics computed with the same tools researchers use.
RAOB · HRRR · RAPEvery 3D scene is fully hands-on: tilt, pan, rotate, and zoom the structure freely, or drop the camera beneath the floor plane to read it from below. For true depth, a side-by-side stereoscopic mode renders the scene for VR — slot a phone (landscape mode) into a Google Cardboard or a Homido clip-on viewer and step inside the atmosphere.
Interactive · SBS VRFrame any scene in the 3D Hodograph or SkewT 3D and hit Share Clip — a short auto-orbit video renders right in the browser as a ready-to-post MP4, with the event, valid time, and data source captioned in the frame. On phones, one tap opens your share sheet.
Pro · Share Clip · MP4// Data Integrity
Missing data renders as a visible gap. Nothing is smoothed over, nothing spans a hole in the record. If a level wasn't measured, you see that it wasn't measured.
Observed balloon data and model output are labeled distinctly at every surface of the app. A model pseudo-sounding never wears an observation's badge.
Rendering scales are anchored to physical units, not stretched per profile. El Reno and Pilger can be compared honestly in 3D, side by side, because neither is normalized to look maxed out.
In the time volume, real cross-sections carry a luminous treatment; in-between frames stay matte. You always know which slice the atmosphere actually reported.
// The Record
Those integrity rules are easy to assert and harder to live with. So we published what they look like applied to somebody else's data: The Record reads all 73,458 tornadoes in the NOAA Storm Prediction Center database against the recording-practice changes baked into it — the F-to-EF changeover in 2007, the unrated class that only begins in 2016, the ratings assigned retroactively from newspaper archives.
The raw count has multiplied since 1950. Almost all of that growth is EF0 and EF1, the classes a denser observing network was always going to find more of. Strong tornadoes are not increasing — and the page shows its work rather than asking you to take that on faith.
Six interactive modules, one static file, no database behind it. Filter by year, state, month and rating; every figure recomputes from the full record.
Read The RecordAnnual US tornado count by rating class, 1950–2025 · NOAA SPC
// Pricing
Free
$0
forever
Pro
$7/month
or $60/year — save $24, over three months free
Pricing shown for launch; final plans may vary. Subscriptions renew until cancelled; 14-day money-back guarantee — see Terms & Refunds. HodoDecoder 3D is a visualization and analysis tool — not a substitute for official warnings. Always heed your local weather service.
// Technology Stack
// Contact
Get in Touch
HodoDecoder 3D is live. Use the form to ask about the app, discuss research collaboration, or reach the developer directly — messages go straight to the inventor, not a support queue.
// Credits & Acknowledgments
HodoDecoder 3D stands on the open-source meteorological Python ecosystem and on the public observation and model archives kept running by the atmospheric-science community. It exists because of the people and institutions below.
All datasets, models, and trademarks belong to their respective owners. HodoDecoder 3D is an independent project and is not affiliated with, endorsed by, or a product of NOAA, the National Weather Service, the University of Wyoming, or any library author named above.
// Also from FullCourt Press
Severe-weather visualization in true 3D — the hodograph with altitude restored as a spatial axis.
You are hereRules-based dollar-cost averaging for Bitcoin and Ethereum, with a daily buy recommendation sized to your plan.
AndroidA privacy-first edge panel for Android — your app shortcuts from any screen, with one swipe.
AndroidTurns any article into a clean reading view — 27 reading fonts, dark mode, read-aloud, and a dictionary.
ChromeMedication logging that takes one tap and keeps its mouth shut — private by default, no streaks, no scores.
Web App